AI
[INTERSPEECH 2025 Series #2] Significance of Time-Frequency Preprocessing for Automatic Ultrasonic Vocalization Classification in Autism Spectrum Disorder Model Detection
|
Interspeech is one of the premier international conferences dedicated to advancing and disseminating research in the field of speech science and technology. It serves as a global platform where researchers, engineers, and industry professionals can share cutting-edge innovations, methodologies, and applications related to speech communication. In this blog series, we are introducing some of our research papers at INTERSPEECH 2025 and here is a list of them. #2. Significance of Time-Frequency Preprocessing for Automatic Ultrasonic Vocalization Classification in Autism Spectrum Disorder Model Detection (Samsung R&D Institute Poland) #3. Adversarial Deep Metric Learning for Cross-Modal Audio-Text Alignment in Open-Vocabulary Keyword Spotting (AI Center-Seoul) #4. Low Complex IIR Adaptive Hear-Through Ambient Filtering for Overcoming Practical Constraints in Earbuds (Samsung R&D Institute India-Bangalore) #5. SPCODEC: Split and Prediction for Neural Speech Codec (Samsung R&D Institute China-Beijing) #6. Efficient Streaming TTS Acoustic Model with Depthwise RVQ Decoding Strategies in a Mamba Framework (AI Center-Seoul) #7. Robust Unsupervised Adaptation of a Speech Recogniser Using Entropy Minimisation and Speaker Codes (AI Center-Cambridge) #8. A Lightweight Hybrid Dual Channel Speech Enhancement System under Low-SNR Conditions (Samsung R&D Institute China-Nanjing) #9. Fairness in Dysarthric Speech Synthesis: Understanding Intrinsic Bias in Dysarthric Speech Cloning using F5-TTS (Samsung R&D Institute India-Bangalore) |
Introduction
Autism spectrum disorder (ASD) is a complex neurodevelopmental condition, and despite years of research, many of its causes and behavioral characteristics remain difficult to fully explain. Mouse models are often used to study ASD because they allow researchers to test genetic and environmental factors in controlled settings. One area of increasing interest is the analysis of ultrasonic vocalizations (USVs) — high-frequency sounds that mice use to communicate during social interactions.
These vocal patterns can reflect differences in behavior and communication, offering a potential way to identify ASD-like traits. However, analyzing USVs manually or with traditional computational tools is slow and can introduce bias, limiting the scale and reliability of such studies.
In this post, we present our deep learning-based approach for detecting ASD-like traits in mice using their ultrasonic vocalizations. Our method processes high-resolution time-frequency representations of 30-second USV fragments using a straightforward architecture combining convolutional and fully connected layers. This solution was submitted to the 1st INTERSPEECH Mice Autism Detection via Ultrasound Vocalization (MAD-UV) Challenge, where it achieved first place with the highest unweighted average recall score of 0.806. We describe the motivation behind our approach, the design choices we made, and how our method contributes to improving the accuracy and scalability of ASD phenotype detection in mouse models.
In this post, we’ll explain how this method works, why it matters, and how it can support future research into ASD by providing a faster and more consistent way to analyze behavioral differences in mice.
Main Contributions and Key Findings
In this study, we developed a deep learning approach that effectively distinguishes between wild-type and ASD mouse models by analyzing their ultrasonic vocalizations (USVs). Our key contributions include:
• A simple yet powerful model architecture combining convolutional and fully connected layers, optimized for capturing fine-grained time-frequency features in USV recordings.
• High-resolution spectrogram preprocessing that highlights the detailed temporal and spectral patterns critical for classification.
• Achieving a segment-level unweighted average recall (UAR) of 0.806 on 30-second USV fragments, significantly outperforming the challenge baseline.
• Winning the 1st INTERSPEECH MAD-UV Challenge, demonstrating the robustness and effectiveness of our approach compared to other submissions.
• Providing insights into the importance of short time windows (e.g., 20–100 ms) for capturing relevant vocalization nuances, which aligns with biological knowledge about mouse communication.
Dataset and Evaluation Metrics
The dataset used in the MAD-UV Challenge included ultrasonic vocalization recordings from 84 mice: 44 wild-type (WT) and 40 ASD model mice. All recordings were made at postnatal day 8 using high-resolution 300 kHz microphones, with each session lasting 5 minutes. These recordings were segmented into non-overlapping 30-second clips.
The test set comprised 16 mice (8 WT and 8 ASD), resulting in 160 audio segments. The remaining 68 mice were split into training and validation sets, with 51 used for training and 17 for validation, according to the official folds provided by the challenge organizers.
To evaluate model performance, two metrics were used:
• Segment-level Unweighted Average Recall (UAR): This was the primary evaluation metric in the challenge. UAR is calculated by computing the recall (true positive rate) for each class individually and then averaging these values. Unlike accuracy, UAR gives equal weight to each class, making it particularly useful in imbalanced classification tasks where one class might dominate. In this context, it ensures that both WT and ASD classes are treated equally, regardless of the number of samples.
• Subject-level UAR: Since each subject contributes multiple 30-second segments, a subject-level prediction was obtained by applying majority voting across all segments belonging to the same mouse. The predicted label for the subject was determined by the most frequent predicted class among its segments. UAR was then computed across all subjects using the same method as in the segment-level case, again ensuring balanced evaluation between the two classes.
Experimental Setup
To ensure fair comparisons across models, we adopted a consistent experimental pipeline throughout our study. All models were trained and validated using the official train/validation split provided by the MAD-UV Challenge organizers, and identical training parameters were applied across all configurations. While we highlight our top-performing model in this post, we also report results from several alternative models that performed well during validation but failed to generalize to the test set. We believe these insights are useful for other researchers working on ultrasonic vocalization (USV) classification, as they reveal common pitfalls and challenges we encountered during development.
Time-Frequency Preprocessing as a Critical Factor
Each 5-minute recording in the dataset was segmented into overlapping 30-second clips with a 15-second overlap to increase the number of training examples. For the primary time-frequency representation, we used spectrograms generated via the Short-Time Fourier Transform (STFT), implemented using the scipy library with a 0.25 Tukey window. To ensure consistent input shapes, we averaged the spectrograms across frequencies, applied a logarithmic transformation (log(1 + x)), and performed min-max normalization. This preprocessing pipeline followed the challenge's official baseline method.
In addition to spectrograms, we explored wavelet-based representations to capture fine-grained temporal patterns in the vocalizations. Motivated by earlier work showing the benefits of high time-resolution features, we computed continuous wavelet transforms (cWT) using Morlet wavelets with a sigma of 2. The transforms were computed across 500 linearly spaced frequencies ranging from 1 Hz to 150 kHz, ensuring full coverage of the ultrasonic vocal range. Since the resulting wavelet scalograms were extremely large (up to 500×9,000,000), we applied temporal smoothing using a 100-sample moving average and downsampled the data to approximately 100 Hz to reduce memory usage and allow batch processing on GPUs.
As shown in the figure below, using a smaller STFT window or the wavelet scalogram helped reveal fine vocalization structures that were blurred in lower-resolution representations. These detailed patterns were particularly important for improving model performance, especially when distinguishing subtle differences in USV patterns between WT and ASD mice.
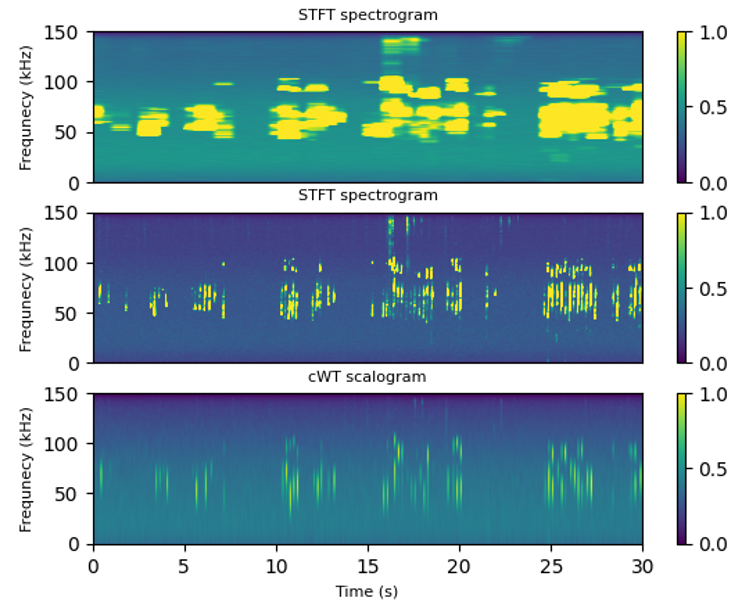
Figure 1. Top: Spectrogram with 1-second window. Middle: Spectrogram with 100 ms window. Bottom: cWT scalogram.
High-resolution spectrograms and wavelet transforms preserve fine-grained temporal features critical to model performance.
As shown, the shorter 100 ms window spectrogram reveals far more detailed vocalization patterns compared to the 1-second version, which blurs the temporal structure. The wavelet scalogram also preserves fine details, albeit at increased computational cost.
Model Architectures
For our experiments, we tested several model architectures to evaluate their effectiveness in classifying mouse ultrasonic vocalizations. We began with a basic convolutional neural network (2xConv+FC) consisting of two convolutional layers—with 32 and 64 filters respectively—followed by a fully connected layer. We then extended this model by adding a third convolutional layer with 128 filters (3/4xConv+2xFC) to capture more complex features before the fully connected layers.
In addition to CNNs, we explored a transformer-based model combining a Swin transformer with a convolutional layer (Swin+Conv). This architecture leveraged the Swin transformer’s ability to extract high-level attention features from audio data, which were then processed by a CNN treating the output as a 2D input.
Finally, we developed a parallel convolutional network with attention (2x2xConv+Att) that processed two time-frequency representations simultaneously: one stream took the spectrogram input while the other processed the continuous wavelet transform scalogram. Outputs from these parallel streams were concatenated and passed through a single attention head to highlight the most relevant features from both inputs.
All models were trained using PyTorch on an NVIDIA A100 GPU with a batch size of 48 for 4000 epochs. We used the Adam optimizer with binary cross-entropy loss, a weight decay of 10⁻⁶, and a learning rate of 2×10⁻⁵. ResNet-like models quickly overfit due to the small dataset and limited number of unique subjects, so we prioritized smaller convolutional networks working with high-resolution spectrogram inputs.
Metaparameter Optimization: Fine-Tuning the Decision Threshold
One of the key hyperparameters in binary classification is the decision threshold—the probability cutoff that decides whether a data point is classified as class 1 or 0. During training, our pipeline automatically searches for the optimal threshold by evaluating segment-level performance using the Unweighted Average Recall (UAR) metric. This is done at each validation epoch through a grid search, testing threshold values from 0 to 1 in steps of 0.05. The checkpoint corresponding to the highest segment UAR on the validation set is saved alongside the chosen threshold.
To ensure the robustness of this threshold, we implemented a 4-fold cross-validation strategy. Each fold maintained a consistent split of subjects between training (51) and validation (17), preserving balanced distributions of ASD vs. wild-type (WT) and male vs. female mice (see Table 1). This careful stratification was critical for fair and consistent evaluation.
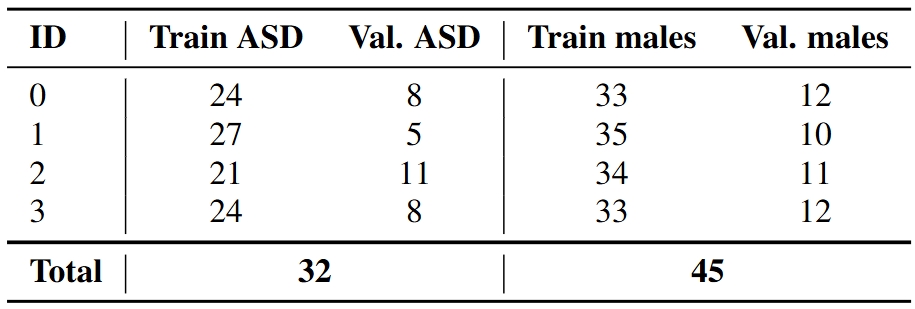
Table 1. Breakdown of the cross-validation folds with ASD and male mouse counts per split.
Interestingly, subject-level UAR results suggested that the optimal threshold might actually be lower than what was found during training with the coarse 0.05 step size. By performing a finer grid search after training, we refined the thresholds for some folds to values as low as 0.36 and 0.41, leading to improved average UARs of 0.88 and 0.90—outperforming the initial thresholds of 0.40 and 0.45 (marked by red and orange dotted lines in Figure 2).
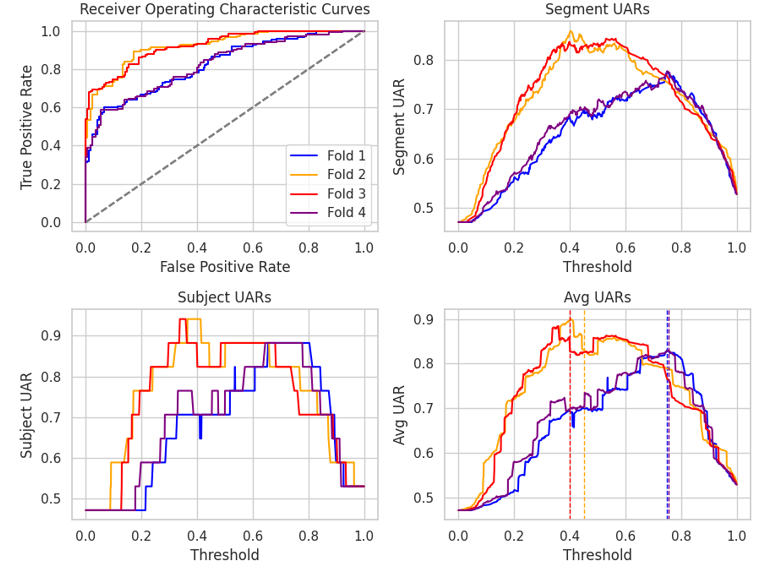
Figure 2. Summary of cross-validation performance metrics across folds, including ROC curves and UAR scores as functions of the decision threshold.
The figure also illustrates how different folds responded to threshold adjustments: folds 1 and 4 peaked at the originally selected threshold, whereas folds 2 and 3 benefitted from lowering the cutoff. This highlights the importance of threshold tuning tailored to each validation fold for optimal classification performance.
Results
• Validation Set Performance
Our validation set consisted of 17 mice, including both ASD and wild-type (WT) subjects, with a total of 318 audio samples segmented into 30-second clips. We evaluated several model architectures using segment-level Unweighted Average Recall (UAR) as the primary metric, while subject-level UAR (aggregated from segment predictions by majority voting) served as a secondary performance indicator.
As shown in Table 2, the model with three convolutional layers followed by two fully connected layers (3xConv+2xFC) achieved the highest subject-level UAR of 0.94, although its segment-level UAR was slightly lower than some smaller models. Notably, the simpler 2xConv+FC architecture performed well on shorter 100 ms windows, with a segment UAR of 0.77 and a subject UAR of 0.88. Larger models tended to overfit faster at the segment level, but they maintained strong subject-level classification. The baseline replication model (2xConv+FC on 1-second windows) showed comparatively lower segment and subject UAR scores.
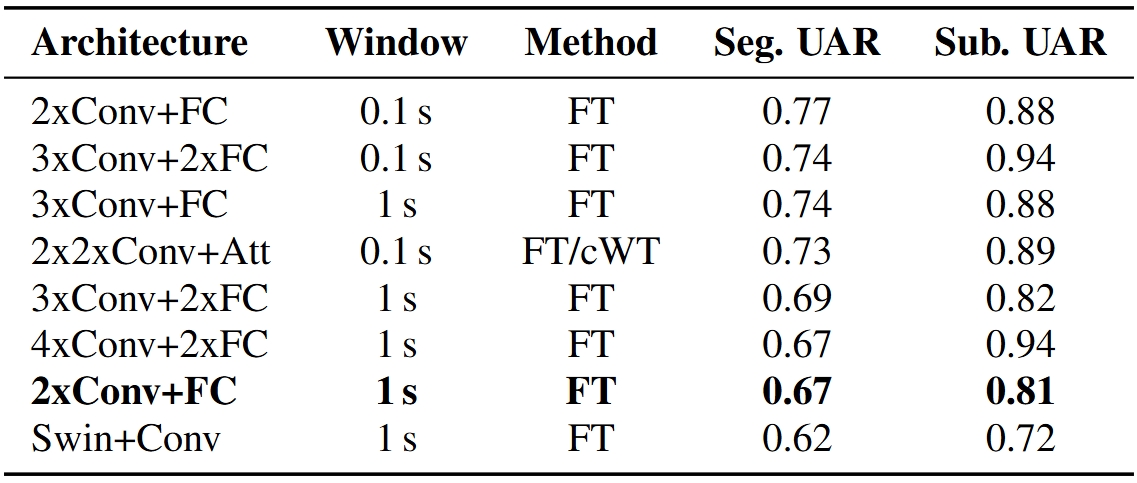
Table 2. : Results of different models on validation set. Bolded model is a baseline replication study on validation set. FT stands for Fourier transform and cWT for wavelet scalogram preprocessing method.
• Challenge Test Set Performance
The challenge test set included 160 unlabeled audio segments from 16 mice (8 WT, 8 ASD). Our best-performing model on this test set was the 2xConv+FC architecture trained on 100 ms windowed Fourier transform spectrograms with 50 ms overlap. This model achieved a segment-level UAR of 0.806 and a perfect subject-level UAR of 1.0, meaning all mice were correctly classified based on the majority vote across their segments.
Interestingly, more complex models or those with additional convolutional layers did not outperform this simpler architecture on the test data, underscoring the importance of model simplicity combined with effective preprocessing. While exact metrics for other models on the challenge test set are unavailable due to undisclosed ground truth labels, most models using high-resolution spectrograms outperformed the baseline challenge results (segment UAR of 0.60 and subject UAR of 0.625).
• Surrogate Test Set Performance
To better estimate model generalizability, we created a surrogate test set from known-labeled data by randomly selecting subjects from the training and validation sets while preserving class and gender ratios. Using the top three checkpoints from validation, we averaged model predictions and performed refined threshold tuning.
As shown in Table 3, replicating the challenge-winning 2xConv+FC model on 100 ms windowed segments yielded improved average segment and subject UARs of 0.7 and 0.75, respectively, compared to 0.67 and 0.7 for the baseline 1-second windowed model. Further increasing temporal resolution to 20 ms and 10 ms windows boosted performance substantially:
• 20 ms window: Segment UAR of 0.81, Subject UAR of 0.92
• 10 ms window: Segment UAR of 0.83, Subject UAR of 0.88
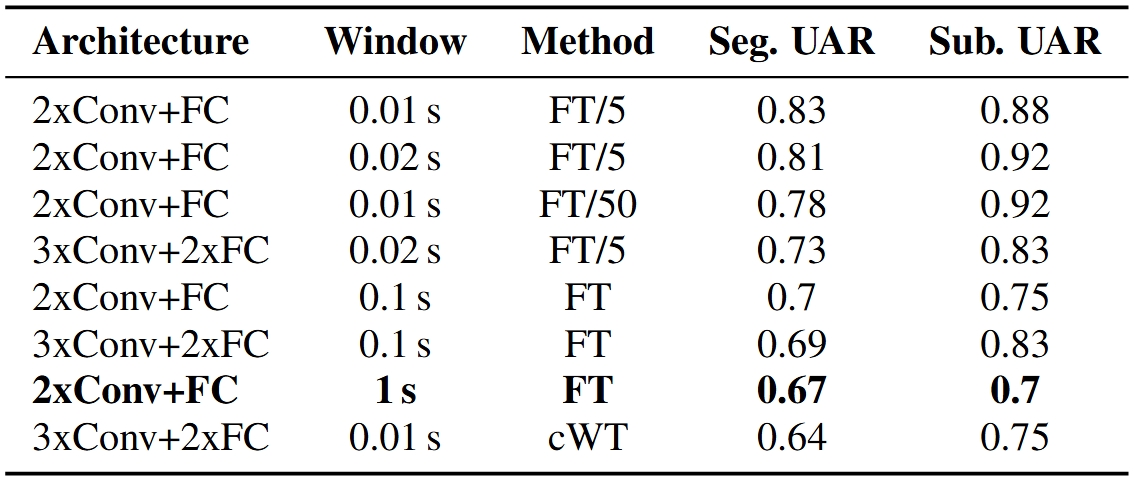
Table 3. Average scores for different models computed from best three (by validation) training epochs. Bolded model is baseline solution from challenge organizers. FT stands for Fourier transform and cWT for wavelet scalogram preprocessing method. FT/5 and FT/50 are spectrograms with 100 and 10 bins instead of default 500.
Reducing frequency resolution (number of frequency bins) was necessary to balance this higher temporal resolution, with FT/5 and FT/50 spectrogram variants representing reduced bin counts of 100 and 10, respectively. Remarkably, even with only 10 frequency bins, the model maintained strong UAR scores (0.78 segment, 0.92 subject).
Adding more convolutional layers or using wavelet-based scalograms (cWT) did not yield further improvements, suggesting that model complexity beyond a certain point may not be beneficial for this task.
Overall, training with high-resolution spectrograms allowed for effective learning without rapid overfitting, particularly for convolutional models. Smaller models converged after roughly 3,000 epochs, highlighting a trade-off between model size, spectrogram resolution, and training duration.
Conclusion
In this study, part of the INTERSPEECH MAD-UV Challenge, we showed that simple convolutional neural networks combined with short-window Fourier transform spectrograms (100 ms and 20 ms) perform best for classifying ultrasonic vocalizations in ASD mouse models. High temporal resolution is key, reflecting the brief duration of rodent calls relevant for distinguishing ASD traits.
Contrary to expectations, more complex models with extra layers or attention mechanisms did not improve results, likely due to the small dataset size. Similarly, continuous wavelet transform representations did not outperform Fourier spectrograms, possibly requiring more specialized models.
Our findings suggest that temporal features like vocalization timing and duration are more important than detailed frequency content. While our approach achieved top challenge rankings and strong surrogate test results, domain-specific adaptations remain necessary, and further research is needed to better understand mouse vocalization complexity.
Overall, this work advances automated USV analysis for ASD detection in mouse models, supporting future computational methods in behavioral neuroscience.
References
[1] Silverman, J.L., Yang, M., Lord, C., & Crawley, J.N. (2010). Behavioural phenotyping assays for mouse models of autism. Nature Reviews Neuroscience, 11(7), 490–502. https://doi.org/10.1038/nrn2851
[2] Moy, S.S., Nadler, J.J., Perez, A., et al. (2004). Sociability and preference for social novelty in five inbred strains: an approach to assess autistic‐like behavior in mice. Genes, Brain and Behavior, 3(5), 287–302. https://doi.org/10.1111/j.1601-1848.2004.00076.x
[3] Nakai, N., Nagano, M., Saitow, F., et al. (2017). Serotonin rebalances cortical tuning and behavior linked to autism symptoms in 15q11-13 CNV mice. Science Advances, 3(6). https://doi.org/10.1126/sciadv.1603001
[4] Scattoni, M.L., Michetti, C., & Ricceri, L. (2018). Rodent Vocalization Studies in Animal Models of the Autism Spectrum Disorder. In Neurobiology of Autism (pp. 445–456). https://doi.org/10.1016/B978-0-12-809600-0.00042-1
[5] Yao, K., Bergamasco, M., Scattoni, M.L., & Vogel, A.P. (2023). A review of ultrasonic vocalizations in mice and how they relate to human speech. The Journal of the Acoustical Society of America, 154(2), 650–660. https://doi.org/10.1121/10.0020544
[6] Möhrle, D., Yuen, M., Zheng, A., et al. (2023). Characterizing maternal isolation‐induced ultrasonic vocalizations in a gene–environment interaction rat model for autism. Genes, Brain and Behavior, 22(3). https://doi.org/10.1111/gbb.12841
[7] Wöhr, M. (2014). Ultrasonic vocalizations in Shank mouse models for autism spectrum disorders: Detailed spectrographic analyses and developmental profiles. Neuroscience and Biobehavioral Reviews, 43, 199–212. https://doi.org/10.1016/j.neubiorev.2014.03.021
[8] Van Segbroeck, M., Knoll, A.T., Levitt, P., & Narayanan, S. (2017). MUPET—mouse ultrasonic profile extraction: a signal processing tool for rapid and unsupervised analysis of ultrasonic vocalizations. Neuron, 94(3), 465–485. https://doi.org/10.1016/j.neuron.2017.04.005
[9] Fonseca, A.H.O., Santana, G.M., Bosque Ortiz, G.M., et al. (2021). Analysis of ultrasonic vocalizations from mice using computer vision and machine learning. eLife, 10, e59161. https://doi.org/10.7554/eLife.59161
[10] Coffey, K.R., Marx, R.E., & Neumaier, J.F. (2019). DeepSqueak: a deep learning-based system for detection and analysis of ultrasonic vocalizations. Neuropsychopharmacology, 44, 859–868. https://doi.org/10.1038/s41386-018-0303-6
[11] Ivanenko, A., Watkins, P., van Gerven, M.A.J., Hammerschmidt, K., & Englitz, B. (2020). Classifying sex and strain from mouse ultrasonic vocalizations using deep learning. PLOS Computational Biology, 16(6), e1007918. https://doi.org/10.1371/journal.pcbi.1007918
[12] Yang, Z., Song, M., Jing, X., et al. (2025). MAD-UV: The 1st INTERSPEECH Mice Autism Detection via Ultrasound Vocalization Challenge. arXiv preprint arXiv:2501.04292. https://arxiv.org/abs/2501.04292