AI
Detecting Depression, Anxiety and Mental Stress in One Sequential Model with Multi-task Learning
Background
Depression, anxiety and excessive mental stress are three common symptoms of mental disorders in modern life, which threaten people’s health and affect their work and quality of life heavily. It is estimated that 350 million people suffer from depression worldwide[1], and anxiety disorders are affecting 40 million adults in the United States age 18 and older, or 18.1 of the population every year[2]. In the first year of the COVID-19 pandemic, global prevalence of anxiety and depression increased by a massive 25[3].
Existing studies that employ behavior features to detect symptoms of mental disorders, including depression, anxiety and stress have achieved promising results. However, previous detection work only focus on symptoms of one of these disorders, seldom considering the correlation between depression, anxiety and mental stress. As different types of mental disorders in conceptual-level, anxiety and depression share a significant nonspecific component encompassing general affective distress and other common symptoms[4]. And people who suffer from the symptoms of anxiety are also prone to depression[5]. Taken into consideration of the latent mechanism between the three symptoms of mental disorders, predicting these three types of disorder simultaneously ensures a more comprehensive understanding of our mental health.
In this blog, we present our recent work which published at HCI International 2022. We propose to learn a multi-task model based on the hypothesis that depression, anxiety and mental stress are strongly correlated. To the best of our knowledge, our work is the first to explore a multi-task framework for mental disorders prediction.
Date Collection and Preprocessing
We recruited 256 adult participants from December 2021 to March 2022. Participants were asked to keep the smart phone and wristband throughout the day for at least 2 weeks. The following features were collected from participants including: (1)mobile usage information: app usage frequency, app usage time, entertainment and social app usage frequency, entertainment and social app usage time, SMS amount, phone usage frequency, phone usage time, incoming phone calls, dialing phone calls, incoming phone calls time, dialing phone calls time, phone calls from acquaintances, phone calls from acquaintances time, (2)diet information: diet frequency, calorie intake, (3)sleeping information: deep sleeping time, shallow sleeping time, wake up time between 11pm. and 7am., sleeping time, (4)moving behaviour information: distance, steps, walking time, running time, running distance, calorie-consumption, (5)location information: location variance[6], number of different places.
During the study, participants were asked to complete the Depression Anxiety and Stress Scale-21[7] (DASS-21) questionnaire every 4 to 7 days which is used to measure depression, anxiety, and stress symptom severity. The scoring criteria are shown in the Table 1. For each task, we regard it as a binary classification. Participants will be labelled as 0 if he or she is classified as Normal via DASS-21, otherwise will be labeled as 1.
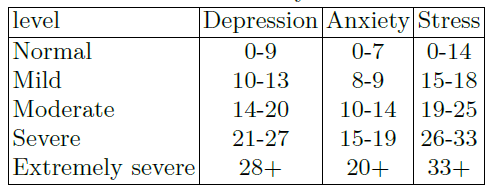
Table 1. Severity levels
Sequential Samples
Based on the submission date of DASS-21, we collected the features of that day and the previous four consecutive days (see Fig. 1). Features of each day are described in Section 3.1. If some a feature is not correctly collected or the feature is blank due to problems such as device connection or participant’s personal reasons, we treat the feature as an invalid feature. For those samples that are not complied with the validness of features, we drop them in the training data. Finally, we get 263 sequential samples.

Figure 1. Sequentially samples collection
Multi-task biRNN
We employ bidirectional recurrent neural network (biRNN) as a base structure for detection model. biRNN is widely used in many sequential classification tasks. It is able to capture the sequential information from forward and backward direction. As the behavior features are sequentially connected, it is natural to utilize RNN model to extract high-level behavior features. Moreover, as we know the symptoms of depression, anxiety and stress are tightly connected, the behavior features that represent depressive symptoms also likely present anxiety, such as sleep disorder. This inspires us to share model parameters among multipledetection tasks. In multi-task learning, different branches are usually used to solve specific tasks[8]. Fig. 2(b) and (c) illustrates overview of our multi-task biRNN structures, which are two types of modeling sharing. They have the same inputs and three outputs. These inputs are fully connected to four hidden layers(Dense 1.1- 1.4) which connect to a shared biRNN. The biRNN connects to three separate hidden layers. Before the output layers, we add a hidden layer Dense and sigmoid activation function in the output layer for each task. Fig. 2(a) shows a single task structure with only one output.


Figure 2. Models structure
Experimental Setup
The ratio of training, validation and testing data against the all data set is of 0.6:0.2:0.2, and use random oversampling on the depression label. The balance rate of positive and negative samples in the validation data and test data is consistent with original data, which is 0.25. To evaluate the performance of prediction between sequential features and statistical features, LR, MLP, SVM, DT and RF are used for comparison. In the second experiment, single task models are considered. In the last group, we use a soft parameter sharing structure for multi-task prediction. Note that the size of Dense 1.1-1.4 is 7:3:3:3 in hard parameter sharing structure. Parameters of Dense 2 in all biRNN structure is twice than those of Dense 3.
During training, we use grid search for the architecture with the number of hidden nodes 32, 64, 128. Next, we choose 0.001 as the initial learning rate and use early stopping. The activation function for each hidden layer is determined by grid search between Relu and tanh. In addition, to avoid overfitting, dropout is used for the optimization. The search space for dropout rate is 0.2, 0.3, 0.4, 0.5.
For each task, the model performance score on test set can be measured by F1 score and AUC. In order to compare the comprehensive performance in the three tasks, we use average F1 score and average AUC.
Model Analysis
Table 2 shows the comparative results of three groups of experiments. Among the five machine learning methods, RF achieves the highest average F1-score(0.71) while MLP achieves the highest average AUC(0.58), however, both were lower than the performance of single biRNN (best avg.F1=0.76, best avg.AUC=0.74). Using time-series data for prediction increases the amount of training data, and we believe that the time-series information enhances the prediction performance. The result, that the comprehensive performance of hard parameter sharing biRNN model is better than that of single biRNN, proves what is learned for single task can improve the performance of other tasks. Compared to the soft parameter sharing structure in the last group, hard parameter sharing structure is more suitable for the prediction of depression, anxiety and stress severity.

Table 2. Comparative result
Samples Analysis
Although the experimental results show that the comprehensive performance of the multi-task structure is better, we would like to know on which samples the multi-task model performs better than the single-task model. Table 3 demonstrates the performance of three single task models and multi-task models on the test set. The test set contains four types of samples ((Depression label = 0, Anxiety label = 0, Stress label = 0), (Depression label = 0, Anxiety label = 1, Stress label = 0), (Depression label = 1, Anxiety label = 1, Stress label = 0), (Depression label = 1, Anxiety label = 1, Stress label = 1)). The multitask model outperforms the single task model in prediction on the samples with the same labels, which is consistent with the premise that the multi-task model is applicable to the related tasks.

Table 3. Samples analysis
Hyperparameter Analysis
We varied our best model in different ways, measuring the change in performance on testingdata. The hyper-parameters consists of (A)bs: batch size; (B)d1, dbiRNN, d2, d3: dimension of Dense 1, biRNN, Dense 2 and Dense 3; (C)dropout; (D)act1, act2, act3: the activation function of Dense 1, Dense 2 and Dense 3. In our experiments, d3 is equal to dbiRNN. These results are presented in Table 4. In Table 4 rows Hard sharing(7-3-3-3)(A), we vary the number of batch size to observe the result. While batch size = 4 is 0.9 avg.f1 and 0.9 avg.AUC worse than the best setting, quality also drops off with too large batch size. In Table 4 rows Hard sharing(7-3-3-3)(B), we observe that increasing the dense1, dense2, biRNNnodes which hurts model quality. We further observe in rows Hard sharing(7-3- 3-3)(C) that, as expected, dropout is helpful in avoiding over-fitting, and 0.2 is better. In rows Hard sharing(7-3-3-3)(D) we replace our activation function with Relu, and observe worse results in this group. Finally we observe varied model structures that hard sharing model, which the size of Dense 1.1-1.4 is 7:3:3:3 is superior to the other two model.

Table 4. Hyperparameter Analysis
Conclusion
In this blog we presented a multi-task sequential model that combines the hard parameter sharing structure and biRNN to achieve a superior prediction performance for three symptoms of mental disorders. The experimental results show that multi-task framework can be applied in the prediction of relevant mental tasks. Compared to statistical features, time sequential features perform better in this depression/anxiety/stress detection task. The future work will focus on using shorter sequential features for prediction. Lastly, our proposed method may be extended to other disorder detection.
References
[1]. World Health Organization. World health statistics 2010. World Health Organization, 2010.
[2]. Anxiety and Depression Association of America. 2021.
[3]. World Health Organization. ”Mental health and COVID-19: early evidence of the pandemic’s impact: scientific brief.”Mental health and COVID-19: early evidence of the pandemic’s impact: scientific brief, 2 March 2022. 2022.
[4]. Clark, Lee Anna, and David Watson. ”Tripartite model of anxiety and depression: psychometric evidence and taxonomic implications.”Journal of abnormal psychology 100.3 (1991): 316.
[5]. Mello, Andrea Feijo, et al. ”Depression and stress: is there an endophenotype?.Brazilian Journal of Psychiatry 29 (2007): s13-s18.
[6]. Saeb, Sohrab, et al. ”Mobile phone sensor correlates of depressive symptom severity in daily-life behavior: an exploratory study.”Journal of medical Internet research.
[7]. Norton, Peter J. ”Depression Anxiety and Stress Scales (DASS-21): Psychometric analysis across four racial groups.” Anxiety, stress, and coping 20.3 (2007): 253-265.
[8]. Caruana, Rich. ”Multitask learning.” Machine learning 28.1 (1997): 41-75.